General Behavior of Infections
Introduction
Problem definition
My semestral paper was on visualization of disease and it´s spreading amongst population. Although there are many models available, most of them are quite straightforward and very simple. Mostly they are concentrating on spreading the disease itself, without any thought places into the surrounding environment, like spread of people. I tried to make the whole system more complex by adding some basic behavior to the agents as well as more variables, by which is the infection defined. This creates a more complex insight into the way of spreading infections. At least to better extend than most models.
Note: I have do add, that the model is far from my liking actually. It still lacks complexity I would like to see and implement. That is partly due to problem with speed. Although simulating 10 000 agents with relatively simple behavior is possible, by adding more and more complex behavior, the whole system started to slow down considerably (I ended with one tick per 30 seconds which is not exactly ideal state for simulating).
Method
For my model of visualization, how diseases spread, I have chosen Netlogo as a tool, as it allows to play with all the values quite easily and reward the user with nice visualization of the whole situation, as well as giving enough data from various graphs and is robust enough, for simulating various relatively complex behavior.
How does it work?
There are two main modules. One take care of logic behind moving of agents and the other one is for infection spread. Although for easier navigation they are split into more files. The whole model consist of breed of agents called people. Patches have attributes, that tells agent, if they are inside city, village or out in country side. People have various decisions how to move. Mostly they move around in either country side, villages or cities. When they are in city, there is very big chance, that they stay inside the city. This simulates behavior, that we stay inside city, work and life here and occasionally venture out. Same goes for villages, but to a smaller degree, as the size of villages are smaller. Once in a while (when WILL to go out is bigger than randomly generated number), agent venture out to a randomly generated coordination. After he reaches it, he goes via the shortest way back where he came from.
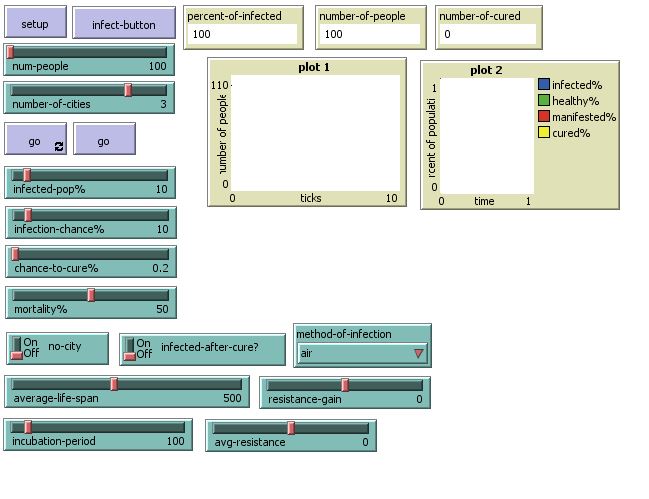
So, how does it all work and who does all those buttons do? It all looks like this.
- SETUP – set up whole model. Meaning people and surrounding.
- GO (infinite) – to run model indefinitely.
- GO(once) – to advance by one tick.
- INFECT-BUTTON – button infect one random agent, who is not infected.
SWITCHES and CHOOSERS:
- NO-CITY - when SETUP is pressed, space is void of cities and villages. This is how most other infection models work and it´s implemented for comparison with other models although agents lacks thanks to this some more advanced behavior. This switch override NUMBER-OF-CITIES slider. Meaning it is not important, how many cities you have chosen to spawn as long as the switch is in ON position.
- INFECTED-AFTER-CURE? - If people can be infected, after they are cured from the disease. Setting the switch to position OFF means, that once agent is cured, he cannot catch the disease again, making him totally immune.
- METHOD-OF-INFECTION - chooses by which method is the disease spread. Either by AIR (which is more effective) or by BODY-CONTACT, which is not se effective in spreading.
SLIDERS:
- NUM-PEOPLE – total number of people created at setup.
- NUMBER-OF-CITIES – number of cities created, which are then randomly spread around the field. The can be connected and theoreticaly emerge at the same location. Although given the number of patches, it is very unlikely. Size of each city can vary slightly due to random element (random-normal 500 200).
- INFECTED-POP% - percent of population already infected at the creation of space.
- INFECTION-CHANCE% - chance of spreading disease in percents. Note, that this is ONLY for rough value. Catching disease is randomized and more complex.
- CHANCE-TO-CURE% - chance to be cured, after the disease make itself known to surrounding. In percents.
- MORTALITY% - chance that disease will kill infected.
- AVERAGE-LIFE-SPAN – average time for each agent, after being infected, to see, if he dies or survives. Each agent life span is calculated by (random-normal average-life-span 100).
- INCUBATION-PERIOD – average time after agent is infected but does not infect other agents. Again, it is individualy calculated using random normal distribution.
- RESISTANCE-GAIN - each time agent get cured, he gain this amount to his resistance roll, so next time, he resist the disease better.
- AVG-RESISTANCE - average value which each agent is given at his setup. If set at 0, each agent has value starting with 0.
Firstly, each patch (space consist of patches) has attribute (type-of-terrain) which is equal to 0 (grass), 1(city) or 2(village). Agents work with those attributes.
Model
Globals: Chance to infect x
Agents: People Centers
Variables: Number of people Number of cities Number of infected population in % Chance to cure
