Simulation of a parking lot in Saint-Petersburg Airport
This page contains a research report representing semester project for 4IT495 Simulation of Systems class (SS 2011/2012).
- Project name: Simulation of a parking lot in Saint-Petersburg Airport
- Project type: Research report
- Class: 4IT495 Simulation of Systems (SS 2011/2012)
- Author: Khabirova Maja
- Model type: Discrete-event simulation
- Software used: Business Process Management Software, SIMPROCESS
Contents
Problem definition
Introduction
Anyone who has ever met or sent off their relatives or colleagues at the Pulkovo airport in Saint-Peterburg, met the need to obtain a parking pass and pay for parking on the exit of the parking lot, if their car has been in for more than 15 minutes. Typically, this system is reasonably robust: approaching drivers line up to the barrier and drive into the territory, getting a parking ticket. To pay for parking, two payment machines are installed; you can pay with cash (both bills and change). In addition, an employee who solves problems related to the entering, exiting and paying in the parking lot is always on duty.
But recently following situation has been repeating: in the busiest hours in just forty minutes the queue to exit the airport begin to grow alarmingly, the drivers are getting nervous, trying to get in free 15-minute interval, they signals at the people who stays too long near payment automats, trying to pay for their ticket.
The situation is following: when a man comes in to the payment automate and tries to put money into the receiving device, the machine does not respond right away, which strongly lengthens the time of payment. The second machine does not accept the money at all, although the display indicates that it is enabled and working properly. From time to time “working” and “idle” machines are swapped.
All attempts to ask the worker responsible for the correct operation of the system for assistance recently lead to nothing. One gets the impression that the assistant is executing an order not to help people with their problems with the payment.
Definition of the task
In this work, the main task is to try to understand what is happening – why does it take so long to pay for the parking ticket and is payment the core of all the problems in this situation at all.
For a start, it was determined that this system is a system with positive feedback: the more cars are in the queue at the exit, the longer time the service for each driver will take. While drivers wait in line, their 15-minutes-of-free-parking interval runs out and they are forced to leave their car, spending extra time to get to the paying machine and pay. It seems obvious that the situation would have been saved by the installation of payment terminals which will accept banking cards or by placing more payment automates, as well as moving them closer to exits barriers.
As was mentioned before, behavior of the assistant seems irrational, too. He was not even trying to indicate non-working payment machines for the drivers, increasing the time spent in unsuccessful attempts to pay.
At the very beginning of the modeling process, it became clear that in this particular logistics system, the term “irrational” was not an absolute. Of course for the drivers the situation was more than irrational: the longer they spent in the queue, the lower the level of service was, however at the same time the payment was getting higher. In this case the drivers had absolutely no opportunity to influence the situation somehow.
For a commercial structure, that is operating the parking lot, situation was more than rational: the inconvenience of the drivers was converted into a direct profit for this commercial structure. Which leads to the fact, that in following case, customers do not pay for the high service level, but for its absence. And payment is exceeding that which they would pay for the high service in properly working system.
Methodology
Chosen methodology
Building a simulation model of this small supply chain will help to analyze processes occurring in it in details. Discrete-event simulation is a convenient tool for simulation in cases like this. It is based on the fact that in the system of discrete-event simulation several simple concepts embodies:
- In accordance with the schedule of arrival and departure of aircrafts certrain “processes” are introduced into the space of this model (in this case: cars with drivers and passengers).
- These cars are the “clients” of the three types of shared, limited in their capacity “servers”: device that is issuing parking tickets at the entrance, the device that verifies parking tickets at the exit and payment machines. Later in this work another type of “server” is being introduced – the employee that services for parking system.
- At the entrance, at the exit and during the process of payment, drivers form a queues, which are based on FIFO the principle – first-in, first out. Later in this paper, Poisson distribution was used to generate the number of cars.
Parameters
Model parameters are the following: arrival schedule of cars, the number of available “servers”, the operation time and time, spent for waiting for passengers at the airport.
According to these considerations, discrete-event model will look like a certain “landfill”, where in discrete moments of time, independent virtual machines are coming and they are operating in order with a given program:
- stand in line to enter the parking lot,
- get a parking ticket,
- wait for passengers,
- stand in line to exit,
- if nessesary, pay for services.
They, in turn, react to events – the release or capture of the resource, the “server”. To make it more realistic, some processes will be described by random variables (the Poisson distribution – arrival time of cars), which means that this version of simulation is a Monte Carlo simulation. In this particular case, for the sake of avoiding complicating of the model, all parameters will have approximate values based on real data. Nevertheless, the figures are rounded, as this task requires not the precise numerical values but the overall trend. Based on this trend, solutions will be formulated later.
All that remains is to choose the platform for the implementation of the model. Nowadays there is a wide choice of modeling systems on the market. There are powerful commercial system with a good visualization support (for ex., a product worked by team of russian developers – AnyLogic, or foreign variants – Arena, SIMSCRIPT and so on), open systems (for ex., GPSS), as well as application libraries. In any of the cases one must have at least minimal skills of development or programming.
My choice was a system of Modeling and Simulation Tools, SIMPROCESS. The system has a broad palette of graphic features, it contains everything that is needed to quick creation of a discrete-event model and obtaining numerical results. An important factor in the decision was existance of a good documentation on this system.
At first, the situation was modeled on the paper. After a little thought originally scheduled algorithm has been extended:
- stand in line to enter the parking lot,
- get a parking ticket,
- wait for passengers,
- stand in line to exit,
- if nessesary, pay for services.
A branch with an assistant on the parking lot was added:
- After payment some of the drivers goes straight to the exit.
- If they had problems, they go to the assistant (for ex., there is a problem with payment or barrier).
- After that, if their problem is solved by the assistant, some of the drivers go to the exit (problem with a barrier is solved).
- If the problem is solved, but payment still needed, drivers return to the “Payment” process.
2.3 Model description
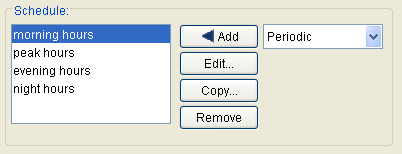
Model starts from the Arrival point. Here number of drivers are generated according to estimated information, based on number of arriving flights. “Shifts“ are divided into 4 sections:
- morning hours – 07:00-12:00, there is approximately 3 drivers/1 minute
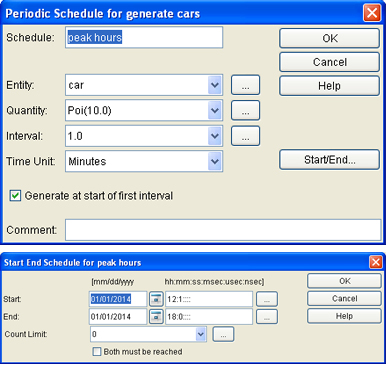
- peak hours – 12:01-18:00, approx. 10 drivers/1 minute
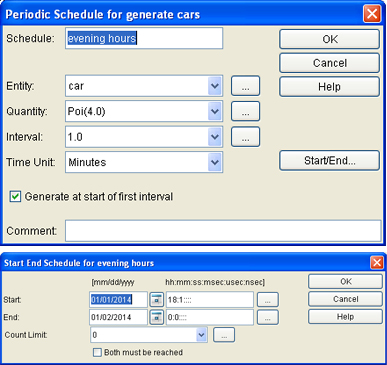
- evening hours – 18:01-00:00, approx. 4 drivers/1 minute
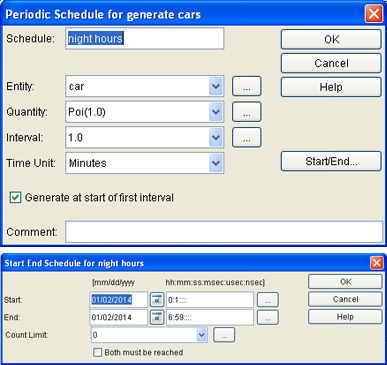
- night hours – 00:01-06:59, approx. 1 driver/1 minute
After drivers are “created“, they need to enter the parking lot. Process of Entering the parking lot is responcible for that. This process is described by a delay – “Getting the ticket“, which takes approx. 15 seconds and needs two “Entry barrier“ resources. After drivers got through the barrier and entered the parking lot, they usually wait for people they came to pick up, get them and their baggage. This process includes a certain delay – approx. 25 minutes.
After they are finished with their business, they need to exit. If they are still inside 15 minutes interval, they go to the exit of the parking lot, where they check their ticket and can ride away usinf one of the 2 exit barriers. This cause a sertain delay, approx. 15 seconds., 1 exit barrier as recources.
If they are out of 15 minutes interval, they need to go to the paying automat to pay for extra time they spent on the parking lot. Branch divides these two groups of drivers and while some of them go to the exit, others need to get to automats and pay. Process of paying with cash cause a delay of about one minute and requires two paying automats as a recource. However, as was mentioned earlier, only one automat is working, that is why in this simulation it will be mentioned as 1.0 in resource field.
Depending on how succesfull the paying was, some drivers may exit right away through one of 2 exit barriers, others may need an assiatance of the parking lot worker to deal with problems like: not working automat, out of cach and credit card only, not working ticket, etc. Parking lot assistant and visit of him is another process. This includes a delay of about 5 minutes. After that drivers can go straight to the exit or go back to the paying process, if still needed.
Results
The first question that is needed to be answered: Is it true, that while the level of service is getting lower, it increases revenue for the company, that provides services at the parking lot? To answer this question, a series of numerical experiments with different numbers of incoming cars during different periods of time were done (these can be called a stress test). The numbers were based on the data of arriving aircrafts, but still they are very approximate. Cars were entering the system in a certain period of time by certain “groups”.
The level of service is the time spent “from gate to gate”, which means average time that cars spent on the territory of the parking lot, although it would be better to summarize the time spent in the queue for entry and exit barrier. It is clear that certain effect of sharp increase of time spent waiting in queue is real and is approximately equal to 15 minutes. After that time half of the drivers needs to get out of their cars to pay. Obviously, the intensity of this effect can get worse by reducing the number of working paying machines and increasing the waiting time.
What happens at this point with the profits from the parking lot? To answer this question it is worth paying attention to the number of cars that does not fall into the 15-minutes-free interval and compare this number to the total number of cars, which entered the parking lot. The theory that was expressed earlier, is confirmed – it is clear that low bandwidth is profitable for the firm, that provides services to parking lot.
How can throughput be improved with minimal cost? One of the obvious solution to the traffic-manager, responsible for the transport component of the terminal (in this case his salary should not be counted as a percentage from profit that parking lot will generate) may be a minimal increase of “free” interval (for ex., from 15 up to 20 minutes). It is clear that such an action will have a positive effect on throughput.
It is clear that the reverse side of this improvement can be the reduction of free space in the area of parking, which can lead to certain problems. At some point it may become a limiting factor (it is not simulated in this scenario for the sake of simplifying the model). The solution to this problem though could be the next step: to encourage drivers spend a shorter time at the parking territory. How can this be achieved? Firstly, relevant information about the arrival of the aircrafts should be provided to the drivers; a board or display can be installed near the entry to the parking lot, or internal airport communications about arrivals and departures can be broadcasted at unallocated FM-band, so that drivers can get the information from the radio in their car.
The second solution could be the following: a selection of special waiting zones outside the airport. Now there are such areas at the entrances of the airport, but they are relatively small.
It is clear from testing results that main problem are (or more precisely – is, because only one is working) payment automats. Due to non-working problem delay for paying the parking fee is relatively long – 1 minute for each client. Enormous lines form because of that.
When number of payment terminals is increased to 4 machines and delay is 20 seconds per client only (because smaller lines form and one can pay without any stress), lines formation process changes dramatically. Of course, due to the reason that only approximate data was used, numbers can seem a bit ridiculous at this stage, but overall trend is absolutely understandable – if we increase a number of payment terminals, it will absolutely have a positive influence on our model.
Conclusion
In conclusion, let us say a few words about the method that was used. In my work, simplest idealized model was used: a description of the algorithm of the coming cars, gates with barriers and payment automates. Despite its simplicity, this model allows us to give a qualitative answer to our questions. Clearly, more detailed models of complicated processses, such as job storage terminal, factory, supermarket, etc. would take much longer to develop, they require data collection and careful calibration. But eventually, the principles remain the same.
Let us not deny that it is usually easier to understand more visualized processses. Visualization takes longer time to be created, but provides additional information about the situation. With the knowledge of how to interpret basic mathematical indicators that can be drawn from a discrete-event model, no less information can be extracted. For example:
- loading of individual resources,
- overall system performance,
- time that customers spend while waiting in the queues at each “server”,
- total time needed for customers’ service.
Simulation models can be used not only to analyze the current situation and scenario of possible development, but also to search for optimal parameters needed for normal work of the
logistic systems.
It is not appropriate to invest time and money to develop a simulation model from the very beginning. Even a simple processs can take a lot of time to be re-created. The best way to use a modeling system are the cases, where the overall dynamics of the logistic system is clear, when we know what are the constraints on resources, all the data are collected and characteristics of the simulated environment are estimated. Only in this situation, a simulation model can be a real tool to support management decision making.
Code
Simulation of a parking lot in Saint-Petersburg Airport, source data
Additional files
Simulation of a parking lot in Saint-Petersburg Airport, documentation
Sources
1. Pulkovo Saint-Petersburg Airport. Pulkovo Saint-Petersburg Airport [online]. [cit. 2012-01-03]. Available from: http://www.pulkovoairport.ru/eng/
2. Pulkovo Parkovki. Pulkovo Aeroport Sankt-Peterburga [online]. [cit. 2012-01-06]. Available from: http://www.pulkovoairport.ru/transportation/parking/
3. Varianty parkovnki v Pulkovo-2. ZlataPraga.ru [online]. [cit. 2011-12-25]. Available from: http://www.zlatapraga.ru/tickets/Parking.php
4. ITone – prosto o slozhnom [online]. [cit. 2011-12-20]. Available from: http://www.itone.ru/bizness_processs/
5. Sistema biznes modelirovanija. Business Studio [online]. [cit. 2011-12-20]. Available from: http://www.businessstudio.ru/


