Difference between revisions of "Simulation of spreading of sexually transmitted infections"
(→Basics) |
(→Used literature) |
||
| (25 intermediate revisions by the same user not shown) | |||
| Line 38: | Line 38: | ||
Average time which people spend by searching for partner 1.5 years. | Average time which people spend by searching for partner 1.5 years. | ||
| − | Probability of giving | + | Probability of giving birth to boy or girl, 50% boy, 50% girl |
The numbers are often not exact in cited sources. They are specified as intervals or they even differ between different sources. So the numbers come from cited sources but I rounded them myself and I often choose some middle value myself. | The numbers are often not exact in cited sources. They are specified as intervals or they even differ between different sources. So the numbers come from cited sources but I rounded them myself and I often choose some middle value myself. | ||
| Line 64: | Line 64: | ||
==Simulation details== | ==Simulation details== | ||
| − | |||
| − | |||
===Properties of a person in simulation=== | ===Properties of a person in simulation=== | ||
| Line 86: | Line 84: | ||
===Basics=== | ===Basics=== | ||
The world is simulated day by day. Each day each agent is asked to live its one day. Each day the agent checks if its age is less then the spefied date of death and possibly dies. Each day each engaged agent consides whether to change partner. With probability p it breaks with partner and tries to find someone else with probability (1-p) it stays with the same partner. That is why the time spent with one partner follows geometrical distribution. p is computed by a formula so the expected time spent with a partner fits the reality. | The world is simulated day by day. Each day each agent is asked to live its one day. Each day the agent checks if its age is less then the spefied date of death and possibly dies. Each day each engaged agent consides whether to change partner. With probability p it breaks with partner and tries to find someone else with probability (1-p) it stays with the same partner. That is why the time spent with one partner follows geometrical distribution. p is computed by a formula so the expected time spent with a partner fits the reality. | ||
| + | |||
| + | Each day every person decides whether it wants to date that day. This decision is from alternative distribution with p as above for engaded people and smaller p for single people, where p for single people is set to the way that average time spent without partner fits the reality. | ||
| + | |||
| + | Afterwards all people which want to date that day (both signgle and engaded) are processed by partner-searching algorithm. Afterwards all people in relation ship are processed by agreement-on-sexual-intercourse algorithm. | ||
===Partner searching algorithm=== | ===Partner searching algorithm=== | ||
| + | |||
| + | Each person which wants to meet someone decides every day whether he or she wants to meet boy or girl. This decission is consistent everyday for everyone with exception for people which have bisexual declination. | ||
| + | |||
| + | If there is someone with the expected gender who is of similar age who wants to meet this gender they become a couple. Previous relationship is breaked away. | ||
| + | |||
| + | If the person doesn't find anyone compatible who want to meet that day. He breaks the previous relationship (if any) anyway but he or she becomes very lonely - it means that he or she will start dating someone at any day someone will want to. | ||
| + | |||
| + | The fact that there might not be be compatible partner is why I write the word approximately in the sentence above: "The time to find partner follows approximately geometric distribution". This behavior - waiting for first possible partner was programmed to approximate this geometric distribution as closely as possible so the number of changed partners in simulation is near to reality. | ||
===Agreement on sexual intercourse=== | ===Agreement on sexual intercourse=== | ||
| + | |||
| + | The sexual appetite property of agents in simulation can be interpreted as the probability that a person will want to have sex that day. This sexual appetite differs for everyone. But is usualy higher for man than for woman. | ||
| + | |||
| + | The couple in this simualtion have sex at any day with probability given by products of these sexual appetites. These quantities are genereted the way that expected value of reciprocacal of this number (i.e. expected freqency of sex) fits the real value. | ||
| + | |||
| + | As mentioned above pairs use condom and after some time they stop using it. | ||
| + | |||
| + | ===Other thigs people do every day=== | ||
| + | |||
| + | They decide whether to take drug or not. They can become drug addicted. Womens can give births. Everyones sexual appetite is day to day sligtly less (0.999945 times) so that it is only 30% of value in young age when people are seniors. People get older every day and eventualy die. | ||
==Visualisation== | ==Visualisation== | ||
| + | |||
| + | Since all people are in one locality by definition. We use NetLogo's graphical capabilities to draw art-like chart of what is happening. The color of agents in the chart denotes the gender of agents and their oriention. Red color denotes women. Blue color denotes man. Sligtly darker color means that the person has bisexual inclination. Slightly lighter color means that the person is homosexual. Xcoordinate is age of person (one patch per year). Y-coordinate of person is the number of partners the person has allready had. It is countet from bottom to top for women and from to to botom for men. The link denotes which people are in relationship. If the simulation is slowed down enough. It can be seen that links are blinking. The actual color of link denotes whether two people have sexual intercourse right now. The white color denotes that people just go out together but are honest. Yellow color denotes sexual intercourse with condom and the red color denotes sexual intercourse without condom. | ||
| + | The shape of agent denotes whether or not is the person infected and how he cought the infection. The person shape denotes clean and healthy pesron. The house shape donotes that the person was born infected. The turtle shape denotes that the person cought the infection by the sexual transfer. The sad-face denotes that the person cought the infection by takeing drugs. | ||
| + | |||
| + | ==User interface== | ||
| + | |||
| + | The user needs to do initial setup. User sets the number of days how long partners use condoms: | ||
| + | |||
| + | [[File:condoms.jpg]] | ||
| + | |||
| + | Then the user sets initial number of people, how many percent of people was infected at the beginning, the mother to child transition probability and sex transition probability. | ||
| + | |||
| + | [[File:setup.jpg]] | ||
| + | |||
| + | Then the user is required to press the setup button. Which initializes everything and then the simulation is started by pressing the button simulateOneDay and by keeping this button pressed. | ||
| + | |||
| + | Afterwards the simulation is started. It looks as follows: | ||
| + | |||
| + | [[File:simulation.jpg]] | ||
| + | |||
| + | User can watch the pertentage of infected people grouped by way how the person was infected: | ||
| + | |||
| + | [[File:percent.jpg]] | ||
| + | |||
| + | Or user can watch absolute numbers: | ||
| + | |||
| + | [[File:abs.jpg]] | ||
| + | |||
| + | From the art-like chart it can be read that people are not using condoms much often. Which showed up very important (viz. conclusion). | ||
| + | |||
| + | ==Conclusion== | ||
| + | |||
| + | The simulation is satisfaing. The outputs are possibly-looking. Good news is that it is relatively safe for anyone to live normal life and don't care about anything and there still will be quite high probability, that one will not get infection. Even after dating infected person there is good chance to be clean as the desease needs repeated unprotected sexual intercourse with infected person to transfer (both in simulation and literature). | ||
| + | However the prognose for future is alarming (both in simulation and in literature). In the scope of hunderts of years the infection rate is growing rapidly. Around one hunderth year of simulation every second person is going to be infected. This ratio then seems to stabilize itself and then the ratio of infected poeple is around 1/2 forever. | ||
| + | |||
| + | This conclusion is however is very sensitive on the fact how long the couples use condoms before they stop using them. So the catastrophical scenario can be bypassed. All what is needed is to use condoms up to two years to decrease this ratio. | ||
| + | |||
| + | The file with simulation can be downloaded from here: [[File:RobertB.nlogo]] | ||
| + | |||
| + | ==Used literature== | ||
| + | |||
| + | http://www.uzis.cz/rychle-informace/vyvoj-infekcnich-nemoci-uzivatelu-alkoholu-jinych-drog-cr-letech-2002-2011 | ||
| + | |||
| + | http://www.ulekare.cz/poradna-lekare/pravdepodobnost-prenosu-viru-hiv-11176 | ||
| + | |||
| + | http://www.hiv-prevence.cz/zpusoby-prenosu.html | ||
| + | |||
| + | http://www.004.cz/hiv-aids-v-gay-komunite | ||
| + | |||
| + | http://ec.europa.eu/health/newsletter/43/newsletter_cs.htm | ||
| + | |||
| + | http://www.lidovky.cz/vice-nez-polovinu-nakazenych-hiv-v-cesku-tvori-homosexualove-p6j-/zpravy-domov.aspx?c=A091201_132530_ln_domov_pks | ||
| + | |||
| + | https://zpravy.aktualne.cz/zahranici/zdravotnici-varuji-v-evrope-se-loni-virem-hiv-nakazil-rekord/r~f492087a942511e5b745002590604f2e/?redirected=1484471740 | ||
| + | |||
| + | http://www.lidovky.cz/vice-nez-polovinu-nakazenych-hiv-v-cesku-tvori-homosexualove-p6j-/zpravy-domov.aspx?c=A091201_132530_ln_domov_pks | ||
| + | |||
| + | https://cs.wikipedia.org/wiki/HIV | ||
| + | |||
| + | http://www.femina.cz/magazin/sex-a-vztahy/velky-sexualni-pruzkum-kolik-mame-za-zivot-partneru-a-co-uz-neni-tabu.html | ||
| + | |||
| + | http://www.uzis.cz/rychle-informace/vyvoj-infekcnich-nemoci-uzivatelu-alkoholu-jinych-drog-cr-letech-2002-2011 | ||
| + | |||
| + | http://www.colourplanet.cz/statistiky-hivaids-v-cr-k-31-7-2016-vzestup-pokracuje/ | ||
| + | |||
| + | http://www.szu.cz/tema/prevence/zprava-o-vyskytu-a-sireni-hiv-aids-za-rok-2015 | ||
Latest revision as of 23:56, 17 January 2017
Contents
Introduction
Spreading of sexually transmitted infections such as HIV is not yet fully understand phonenomena. The problem with statistics is that he real number of HIV possitive people is latent. Only the number of people which know about their infections is known. The real number of people which are infected must be only estimated. One of methods of how this number can be estimated is by agent based simulation where agents - people behave similarily to real people.
Software
NetLogo 6.0 (Decemeber 20, 2016)
Methods, limitations and goal
The speed of speding of sexually transmitted infections depends mainly on sexual behavoir of people. The behavior of agents was set to follow the answers from behavioral researches. The goal is that the simulation will be approximation of reality. Since it is hard to simulate whole world the simulation is limited to one relatively closed place. The people in simulation cannot move to other locality and other people do immigrate to the simulation. We conjecture that migration to and from nearby towns and cities would not have big impact since it is almost equivalent to dying agents and to new agents being born from the observers view.
However background reaseach showed that other factors impact the number of HIV positive people which is not not captured by the simulation. The main of them is tourism. It is evident that the infection speads in tourstical destinations and by the flow of turists. Even in czech republic the increase of new HIV possitive people corellates with the popularity of turistical destinations such as Thailand.
We omit this, other political and demographical problems and simulate only the simplest sexual behaviour of people. People in this simulation can be born eaither healthy or infected depending on whether the mother is infected or not. Everybody is either heterosexual, homosexual or bisexual. People start looking for similar partner at the age of pubescence and might change partner several times during life. (Honest veterans can exist, but it is rare.) Pairs then have sex iregularily several times per month. Every pair in the simulation uses bairer protection such as condoms in the beggining of partnership and later stops using it if the partnership lasts for some random time. At the times when the pair doesn't use such protection the infection can be transmited with certain.
Some people also take drugs introvenously in the simulation which can cause them being infected too.
Behavioral parameters which were set to be the same as in reality
Age when person starts sexual life
Length of year - 365.25
Lifeexpectancy - 78 years
Probability of using a drug - 0.05
Average number of children per mother - 2.00
Average number of partners per life - 10
Probability of bisexual behavior 18%
Probability of beeing homosexual 4%
The frequency of sex once per 8 days in hererosexual pairs. More often in gay pairs and less often in lesbian pairs
Average time which people spend by searching for partner 1.5 years.
Probability of giving birth to boy or girl, 50% boy, 50% girl
The numbers are often not exact in cited sources. They are specified as intervals or they even differ between different sources. So the numbers come from cited sources but I rounded them myself and I often choose some middle value myself.
Especially problematic is the number of partners. According to background research the number of partners of average girl and of average boy. Girls were supposed to change 8 boys during life. But boys were supposed to change 12 girls during life. It is impossible since the number of boys and girls is similar. The difference is probably caused by the people lying in researches. That is why I set the number to 10.
Infection transmission probabilities
These parameters are also not known exactly and they differ between different infection HIV/sifilis/other. The default values in simulation are set to fit HIV.
The serios literature doesn't specify the probabilites exactly but only as interval estimate. The probability of mother to child transmission is supposedly 10 - 20%.
The real probability of transmission of desease by sexual intercourse is much more complicated and depends on many factors. It depends on the length and intenzity of intercourse and on degree of injury to the mucosa. After a consultation with a friend from K-Centrum Liberec I set this probability to 0.08.
Both parameters can be set by user using a slider. This way use can run simulation and see what happens when he or she has diferent knowleadge or if he wants to see results for different desease.
Parameters which are not the same as in reality
Even though it was possible to find estimates of real-valued parameters their distribution often doesn't follow reality exactly in this simulation. I often used the found values to generate distribution with the same expected value and sometimes with the same standard deviation but not exactly from the same distribution.
The lenght of life is generated from truncatenated normal distribution. Womens give births to children with specified probability given by formula which says that expected number of children a women with average length of life is 2.0. So only the average number of childrens fits the realtity. Not the probability distribution of this number.
Simiarly other vere generated the way that their expected value should fit the reality. But their distribution is collary of used algorithm. Namely: The number of partners follows approximately poisson distribution, the time to find partner follows approximately geometric distribution. The time a person insists on using a condom is drawn from uniform distribution between 0 and 1 year at the time a person is born. Since in the simulation both partners are required to agree with not using the condom the collary is that the time a pair uses a condom is from triangular probability distribution, the time spent with a partner follows geometric distribution.
Simulation details
Properties of a person in simulation
Most of the properties of a person is determined at the moment when a person is born.
These properties include:
- Length of life
- Sexual appetatite
- Mans has this quantity higher than womans.
- These values from both partners are used to compute the probability that partners will have sexual intercourse (see algorithm bellow) and its expected frequnecy fits the real values.
- gender
- sexual orientation
- age when person starts sexual life
- drug taking probability
- frequency of sharing a needle
- degree of bisexuality
Basics
The world is simulated day by day. Each day each agent is asked to live its one day. Each day the agent checks if its age is less then the spefied date of death and possibly dies. Each day each engaged agent consides whether to change partner. With probability p it breaks with partner and tries to find someone else with probability (1-p) it stays with the same partner. That is why the time spent with one partner follows geometrical distribution. p is computed by a formula so the expected time spent with a partner fits the reality.
Each day every person decides whether it wants to date that day. This decision is from alternative distribution with p as above for engaded people and smaller p for single people, where p for single people is set to the way that average time spent without partner fits the reality.
Afterwards all people which want to date that day (both signgle and engaded) are processed by partner-searching algorithm. Afterwards all people in relation ship are processed by agreement-on-sexual-intercourse algorithm.
Partner searching algorithm
Each person which wants to meet someone decides every day whether he or she wants to meet boy or girl. This decission is consistent everyday for everyone with exception for people which have bisexual declination.
If there is someone with the expected gender who is of similar age who wants to meet this gender they become a couple. Previous relationship is breaked away.
If the person doesn't find anyone compatible who want to meet that day. He breaks the previous relationship (if any) anyway but he or she becomes very lonely - it means that he or she will start dating someone at any day someone will want to.
The fact that there might not be be compatible partner is why I write the word approximately in the sentence above: "The time to find partner follows approximately geometric distribution". This behavior - waiting for first possible partner was programmed to approximate this geometric distribution as closely as possible so the number of changed partners in simulation is near to reality.
Agreement on sexual intercourse
The sexual appetite property of agents in simulation can be interpreted as the probability that a person will want to have sex that day. This sexual appetite differs for everyone. But is usualy higher for man than for woman.
The couple in this simualtion have sex at any day with probability given by products of these sexual appetites. These quantities are genereted the way that expected value of reciprocacal of this number (i.e. expected freqency of sex) fits the real value.
As mentioned above pairs use condom and after some time they stop using it.
Other thigs people do every day
They decide whether to take drug or not. They can become drug addicted. Womens can give births. Everyones sexual appetite is day to day sligtly less (0.999945 times) so that it is only 30% of value in young age when people are seniors. People get older every day and eventualy die.
Visualisation
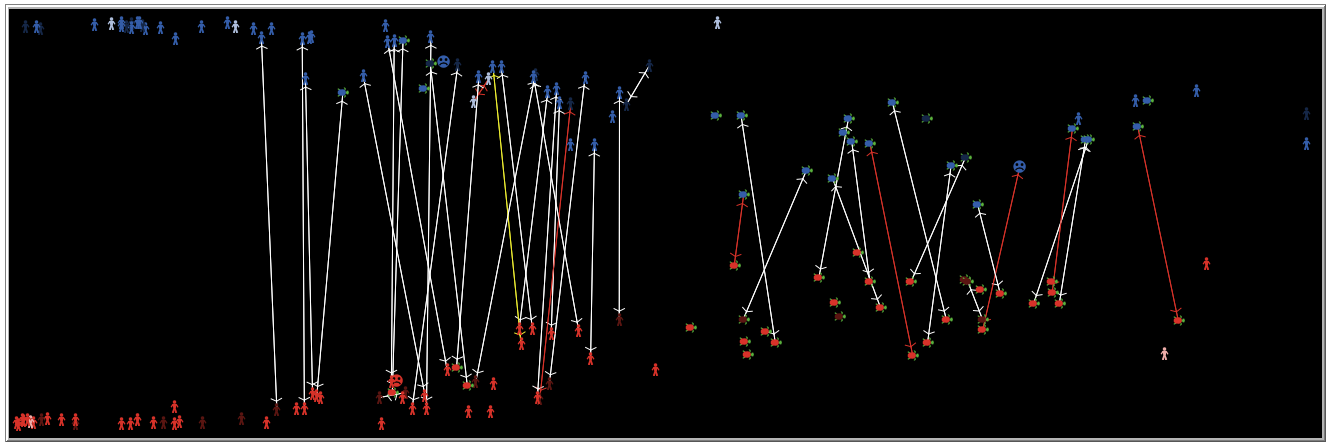
Since all people are in one locality by definition. We use NetLogo's graphical capabilities to draw art-like chart of what is happening. The color of agents in the chart denotes the gender of agents and their oriention. Red color denotes women. Blue color denotes man. Sligtly darker color means that the person has bisexual inclination. Slightly lighter color means that the person is homosexual. Xcoordinate is age of person (one patch per year). Y-coordinate of person is the number of partners the person has allready had. It is countet from bottom to top for women and from to to botom for men. The link denotes which people are in relationship. If the simulation is slowed down enough. It can be seen that links are blinking. The actual color of link denotes whether two people have sexual intercourse right now. The white color denotes that people just go out together but are honest. Yellow color denotes sexual intercourse with condom and the red color denotes sexual intercourse without condom. The shape of agent denotes whether or not is the person infected and how he cought the infection. The person shape denotes clean and healthy pesron. The house shape donotes that the person was born infected. The turtle shape denotes that the person cought the infection by the sexual transfer. The sad-face denotes that the person cought the infection by takeing drugs.
User interface
The user needs to do initial setup. User sets the number of days how long partners use condoms:
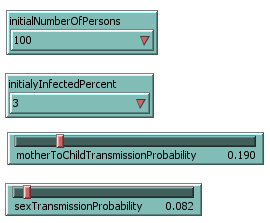
Then the user sets initial number of people, how many percent of people was infected at the beginning, the mother to child transition probability and sex transition probability.
Then the user is required to press the setup button. Which initializes everything and then the simulation is started by pressing the button simulateOneDay and by keeping this button pressed.
Afterwards the simulation is started. It looks as follows:
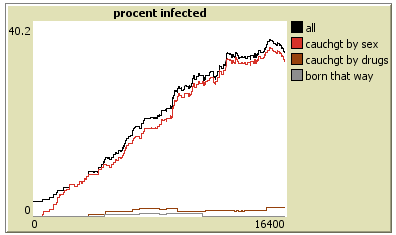
User can watch the pertentage of infected people grouped by way how the person was infected:
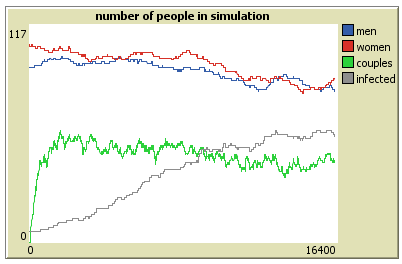
Or user can watch absolute numbers:
From the art-like chart it can be read that people are not using condoms much often. Which showed up very important (viz. conclusion).
Conclusion
The simulation is satisfaing. The outputs are possibly-looking. Good news is that it is relatively safe for anyone to live normal life and don't care about anything and there still will be quite high probability, that one will not get infection. Even after dating infected person there is good chance to be clean as the desease needs repeated unprotected sexual intercourse with infected person to transfer (both in simulation and literature). However the prognose for future is alarming (both in simulation and in literature). In the scope of hunderts of years the infection rate is growing rapidly. Around one hunderth year of simulation every second person is going to be infected. This ratio then seems to stabilize itself and then the ratio of infected poeple is around 1/2 forever.
This conclusion is however is very sensitive on the fact how long the couples use condoms before they stop using them. So the catastrophical scenario can be bypassed. All what is needed is to use condoms up to two years to decrease this ratio.
The file with simulation can be downloaded from here: File:RobertB.nlogo
Used literature
http://www.ulekare.cz/poradna-lekare/pravdepodobnost-prenosu-viru-hiv-11176
http://www.hiv-prevence.cz/zpusoby-prenosu.html
http://www.004.cz/hiv-aids-v-gay-komunite
http://ec.europa.eu/health/newsletter/43/newsletter_cs.htm
https://cs.wikipedia.org/wiki/HIV
http://www.colourplanet.cz/statistiky-hivaids-v-cr-k-31-7-2016-vzestup-pokracuje/
http://www.szu.cz/tema/prevence/zprava-o-vyskytu-a-sireni-hiv-aids-za-rok-2015


