Spread of Disease
Contents
- 1 Introduction
- 2 Method
- 3 Model
- 4 Results
- 4.1 Case 1: High population density, no quarantine
- 4.2 Case 2: High population density, quarantine
- 4.3 Case 3: High population density, quarantine, symptoms show after 5 days
- 4.4 Case 4: Low population density, no quarantine
- 4.5 Case 5: Low population density, long contagiousness
- 4.6 Case 6: High population density, long contagiousness
- 5 Conclusion
- 6 Future improvements for the model
- 7 Code
Introduction
This goal of this simulation is to see how diseases spread among populations. It tries to find which factors are the most crucial in creating an epidemic. Under certain conditions a disease has the ability to be devastating to its affected population. For example, the Bubonic Plague is estimated to have killed 30% - 60% of the European population. This model aims to see how such a catastrophe could happen, and whether certain actions can be taken to avoid it.
Method
Software
NetLogo 5.3.1 was used for this simulation.
Simulation Details
The simulation tries to illustrate how diseases may spread across populations. There is only one turtle in play; humans. The simulation is not based on any specific scientific article, but tries to show which parameters may cause an epidemic. The main measurement of the model is to see how many people are infected by the disease in different cases.
Model
People
The model contains only one turtle; humans. Humans are divided into two groups, healthy or sick. When a human is sick there is a chance they will infect other humans they come into contact with. After a number of days, the sick person will “die” as they are no longer relevant to the model. Either they have combated the disease and gained immunity, or they have, in fact, died. In default, every human is set to wander randomly.
Contagiousness
The chance of contaminating other people depends highly on the type of disease. To accommodate for this, the model has an added slider that affects the chance that a sick person will infect others.
Patient Zero
There is also a slider that chooses how many sick turtles the model contains initially.
Number of contagious days
Another variable of importance is for how long each person is contagious. This may have significant impact on the result of the model.
Quarantine
The model also has a quarantine option. When this is turned on every sick person will move towards the centre, while healthy people will move away from the centre. It is also possible to change how many days it takes for people to move towards the quarantine. This is done to reflect how some diseases do not show symptoms before a certain number of days, but may still be contagious prior to this.
Results
Case 1: High population density, no quarantine
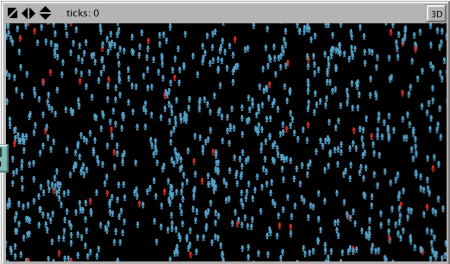
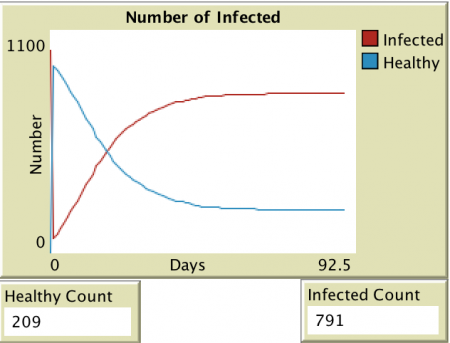
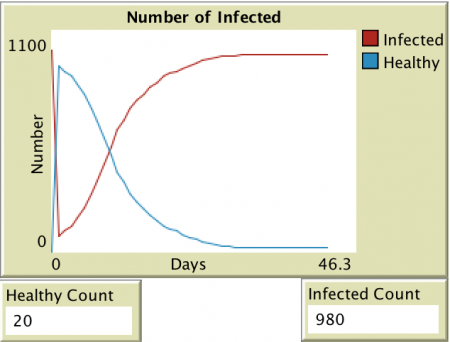
In this case there is a high population density (1000 people), there is 100% of infection, there are 50 patient zeros, patients are contagious for 10 days, and there is no quarantine.
In this case we see that 79 % of the population gets infected by the disease.
Case 2: High population density, quarantine
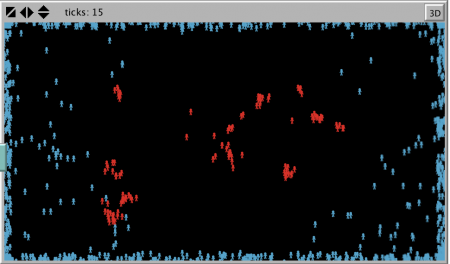
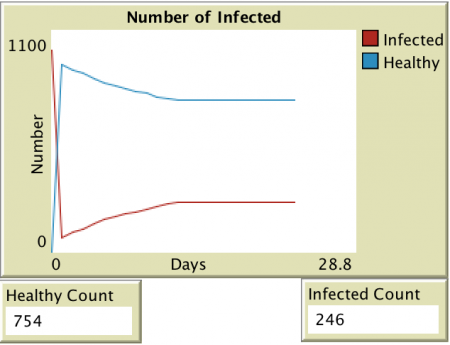
This case is the same as the first, with the only difference that there is a quarantine in place. Symptoms are detected immediately after people are infectious, and so they move towards the quarantine zone.
The effect of the quarantine is significant, and only 24.6 % the population is infected.
Case 3: High population density, quarantine, symptoms show after 5 days
This case is similar to the last two, with the exception that patients go to the quarantine zone 5 days after becoming contagious.
In this case the results are devastating, where 98 % of the population is infected. This might seem counterintuitive, but it’s probably caused by the simplicity of the model. The quarantine zone is simply too big, causing very high density of humans away from the quarantine zone. This again accelerates the spread of the disease.
Case 4: Low population density, no quarantine
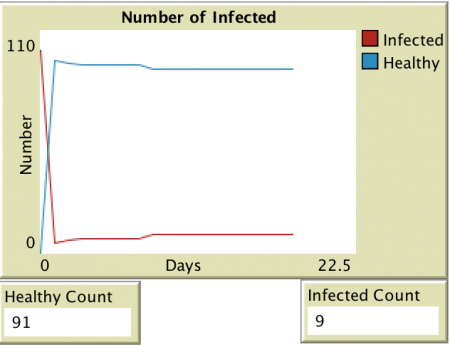
This case is similar to the first one with exception that there are only 100 humans, and there are only 5 patient zeros (5 %). There is 100% of infection, patients are contagious for 10 days, and there is no quarantine.
We see that in this case only 9 % are infected by the disease.
Case 5: Low population density, long contagiousness
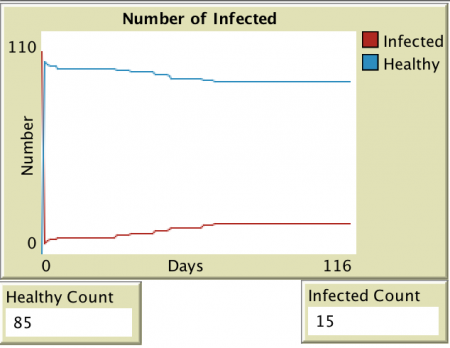
This case has the same parameters as the previous one with the exception that patiens are contagious for 50 days.
Longer contagiousness causes a higher number of infected, but the increase is not extreme.
Case 6: High population density, long contagiousness
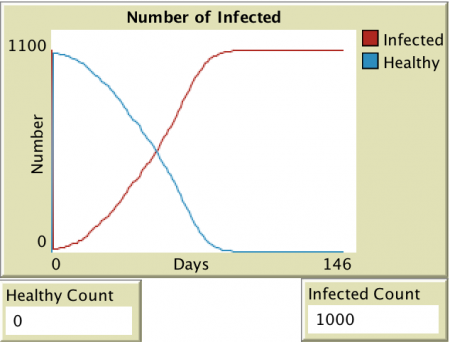
This is the same as the previous case, but again with a high population density.
In this case, everyone gets infected by the disease.
Conclusion
It is clear from the results that population density is the most important parameter concerning the spread of disease. This coincides with what we know about historical diseases, where they can have a devastating effect on high population density centres, but affects small villages marginally. The number of days that people are contagious has a great effect when population is dense, but is not of great importance when there is a low population. The quarantine also works as a great way to limit the spread of diseases, but proved faulty in the model when symptoms did not show immediately. There are countless other cases that could be examined, but the effect of factors such as infection chance and the number of initial patients is quite easy to predict.
Future improvements for the model
The model is quite simple, with humans wandering randomly about. A huge improvement for the model would be to make it so that people had homes and would go to work until symptoms showed. Additionally, in its current form, the model’s quarantine feature makes it so that people gather in huge crowds even though they aren’t sick, making the disease spread like wildfire when symptoms don’t show early.
