Difference between revisions of "COVID-19 symptoms"
| Line 47: | Line 47: | ||
'''a''' controls the steepness of the probability function and represents how much will a change in A affect the chance of activating the symptom. The parameter a has been adjusted according to the probability of a hospitalized COVID-19 patient developing the symptom. | '''a''' controls the steepness of the probability function and represents how much will a change in A affect the chance of activating the symptom. The parameter a has been adjusted according to the probability of a hospitalized COVID-19 patient developing the symptom. | ||
| − | And finally, '''b''' represents the threshold of a symptom - the higher b, the more activity in the neighbors such symptom needs to become activated. To take in consideration false positivity, the parameter b has been adjusted according to the combined probabilities of a patient developing said symptom while sick with the COVID-19 virus, the common flu, or cold. For example, for a symptom with the probability of development of 0.90199, the threshold has been set to 0.09801. The more common a symptom is, the higher are the chances of it appearing | + | And finally, '''b''' represents the threshold of a symptom - the higher b, the more activity in the neighbors such symptom needs to become activated. To take in consideration false positivity, the parameter b has been adjusted according to the combined probabilities of a patient developing said symptom while sick with the COVID-19 virus, the common flu, or cold. For example, for a symptom with the probability of development of 0.90199, the threshold has been set to 0.09801. The more common a symptom is, the higher are the chances of it appearing on it's own (not being caused/followed by other symptoms). |
=4. Results= | =4. Results= | ||
Revision as of 13:27, 20 January 2021
In progress!
Name: COVID-19 symptoms simulation
Author: Kamila Steinbartová, stek15, Jan 2021
Used tool: NetLogo 6.1.1
Contents
1. Problem definition
We are all familiar with the present pandemic situation. One of the main factors of the financial impact of the disease is the need for testing. Be it individual or nation-wide, the time, resources, and personnel required are far beyond what could be manageable long-term. Securely identifying the symptoms and tracking them could allow for more accurate quarantine measures.
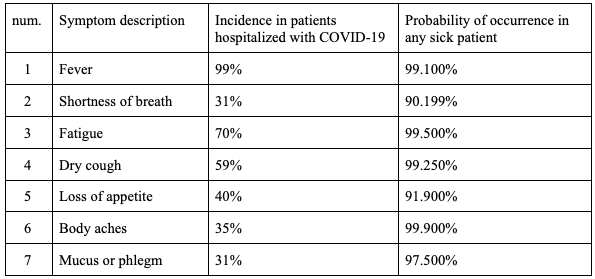
The available information on the COVID-19 disease is being constantly updated and developed. To take this into consideration, the model was created to be adaptable and easily editable. Even during the course of model creation, which only took a couple of weeks, the most commonly listed symptoms have been updated based on newly available information several times. The final list of 7 of the most common symptoms among patients hospitalized with COVID-19 as stated by Chinese researchers has been taken from https://www.webmd.com/lung/covid-19-symptoms#1.
The table below lists said symptoms, their percentual incidence in patients hospitalized with COVID-19, and the added probability P(A∪B∪C) of occurrence in any sick patient (considering COVID-19, the common cold, and the flu), calculated from data taken from https://www2.hse.ie/conditions/coronavirus/symptoms.html).
The use of these parameters in my simulation is explained in the following sections.
2. Method
The tool used for this simulation is NetLogo 6.1.1.
3. Model
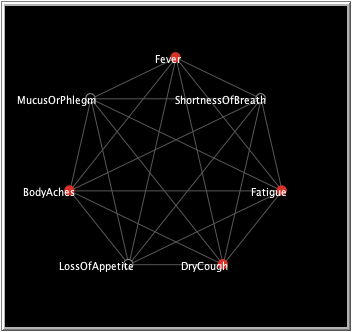
This model is a representation of the COVID-19 virus, or rather of the effects said virus has on an affected person. Each node of the model represents one of the 7 symptoms listed above. The model simulates the development of the symptoms in a patient. If the symptom turns red, it became activated (experienced). Upon deactivation, it turns black again. Each symptom is connected to all the others in order to create a conclusive network.
Before the simulation is started, the user is to choose the initial settings for the model using the two sliders on the left side of the model: contraction-susceptibility and exposure-to-virus. With the current settings, a patient is suspected positive, if they are experiencing 4 or more symptoms.
The plot shows the number of activated symptoms over time (per tick). As the exposure-to-virus slider is adjusted, the green line moves up or down accordingly. The same goes for contraction-susceptibility and the grey line. A person with very low contraction-susceptibility (e.g. a young, healthy, active person, or, quite newly, also a person that has been vaccinated) will be much less likely to cross the black suspected-positivity-line, even if the exposure-to-virus rate is very high. Similarly, an elderly person with long-term respiratory issues would be considered very contraction susceptible, and even a low exposure-to-virus rate might cause such person to cross the suspected-positivity-line.
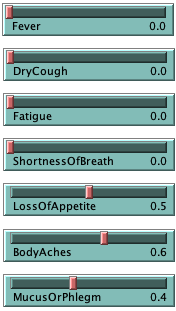
With the sliders per symptom on the right side of the model, it is possible to intervene on a specific symptom by curing it (by lowering it to 0.0). Similarly, it is possible to first set up the network with several symptoms (of identical or differing values) and see how such a patient progresses over time.
The probability of becoming activated for each symptom is represented as 1 / 1 + e^(a(b - A)).
Here, A represents the total amount of stress on a symptom (slider of symptom + exposure-to-virus + the activity of it's neighbors). In other words, A shows us how much pressure there is on the symptom to become activated.
a controls the steepness of the probability function and represents how much will a change in A affect the chance of activating the symptom. The parameter a has been adjusted according to the probability of a hospitalized COVID-19 patient developing the symptom.
And finally, b represents the threshold of a symptom - the higher b, the more activity in the neighbors such symptom needs to become activated. To take in consideration false positivity, the parameter b has been adjusted according to the combined probabilities of a patient developing said symptom while sick with the COVID-19 virus, the common flu, or cold. For example, for a symptom with the probability of development of 0.90199, the threshold has been set to 0.09801. The more common a symptom is, the higher are the chances of it appearing on it's own (not being caused/followed by other symptoms).


